Recent
Recent
© Neydtstock | Dreamstime.com

Top Stories
Top Stories
IndustryWeek

Recommended
Recommended


Companies & Executives
Musk: Tesla Will Solve Autonomy
April 24, 2024
Designer491/Dreamstime

Cleveland-Cliffs Corp.

Dreamstime

Competitiveness
Nearshoring and China's Four 'Ds'
April 25, 2024
Siemens
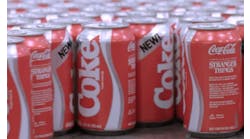
Coca-Cola Co.
© Yuryz | Dreamstime.com

Members Only Content
Innovation
Is Your Intellectual Property Under Attack?
April 23, 2024
R.A Jones


© Spaxia | Dreamstime.com

Continuous Improvement
Fix Your Just-in-Time Engine
April 17, 2024
© Navee Sangvitoon | Dreamstime.com


© Olivier Le Moal | Dreamstime.com

© Richair | Dreamstime.com

© Yukchong Kwan | Dreamstime.com

YouTube screen capture from PixCams

Members Only Content
© Flynt | Dreamstime.com

© Flynt | Dreamstime.com

IndustryWeek

Photo 137592009 | 5g © Ekkasit919 | Dreamstime.com

Members Only Content
Courtesy of ABB

© Alexandersikov | Dreamstime.com

AT&T
© Georgii Dolgykh | Dreamstime.com

IIoT
Meet the 'Fab Five' of IT/OT Leadership
March 26, 2024
Featured Media
Featured Media
ID 202424474 © Alendimion | Dreamstime.com

© Dizain777 | Dreamstime.com

IndustryWeek